Investor Relations
Financial Information
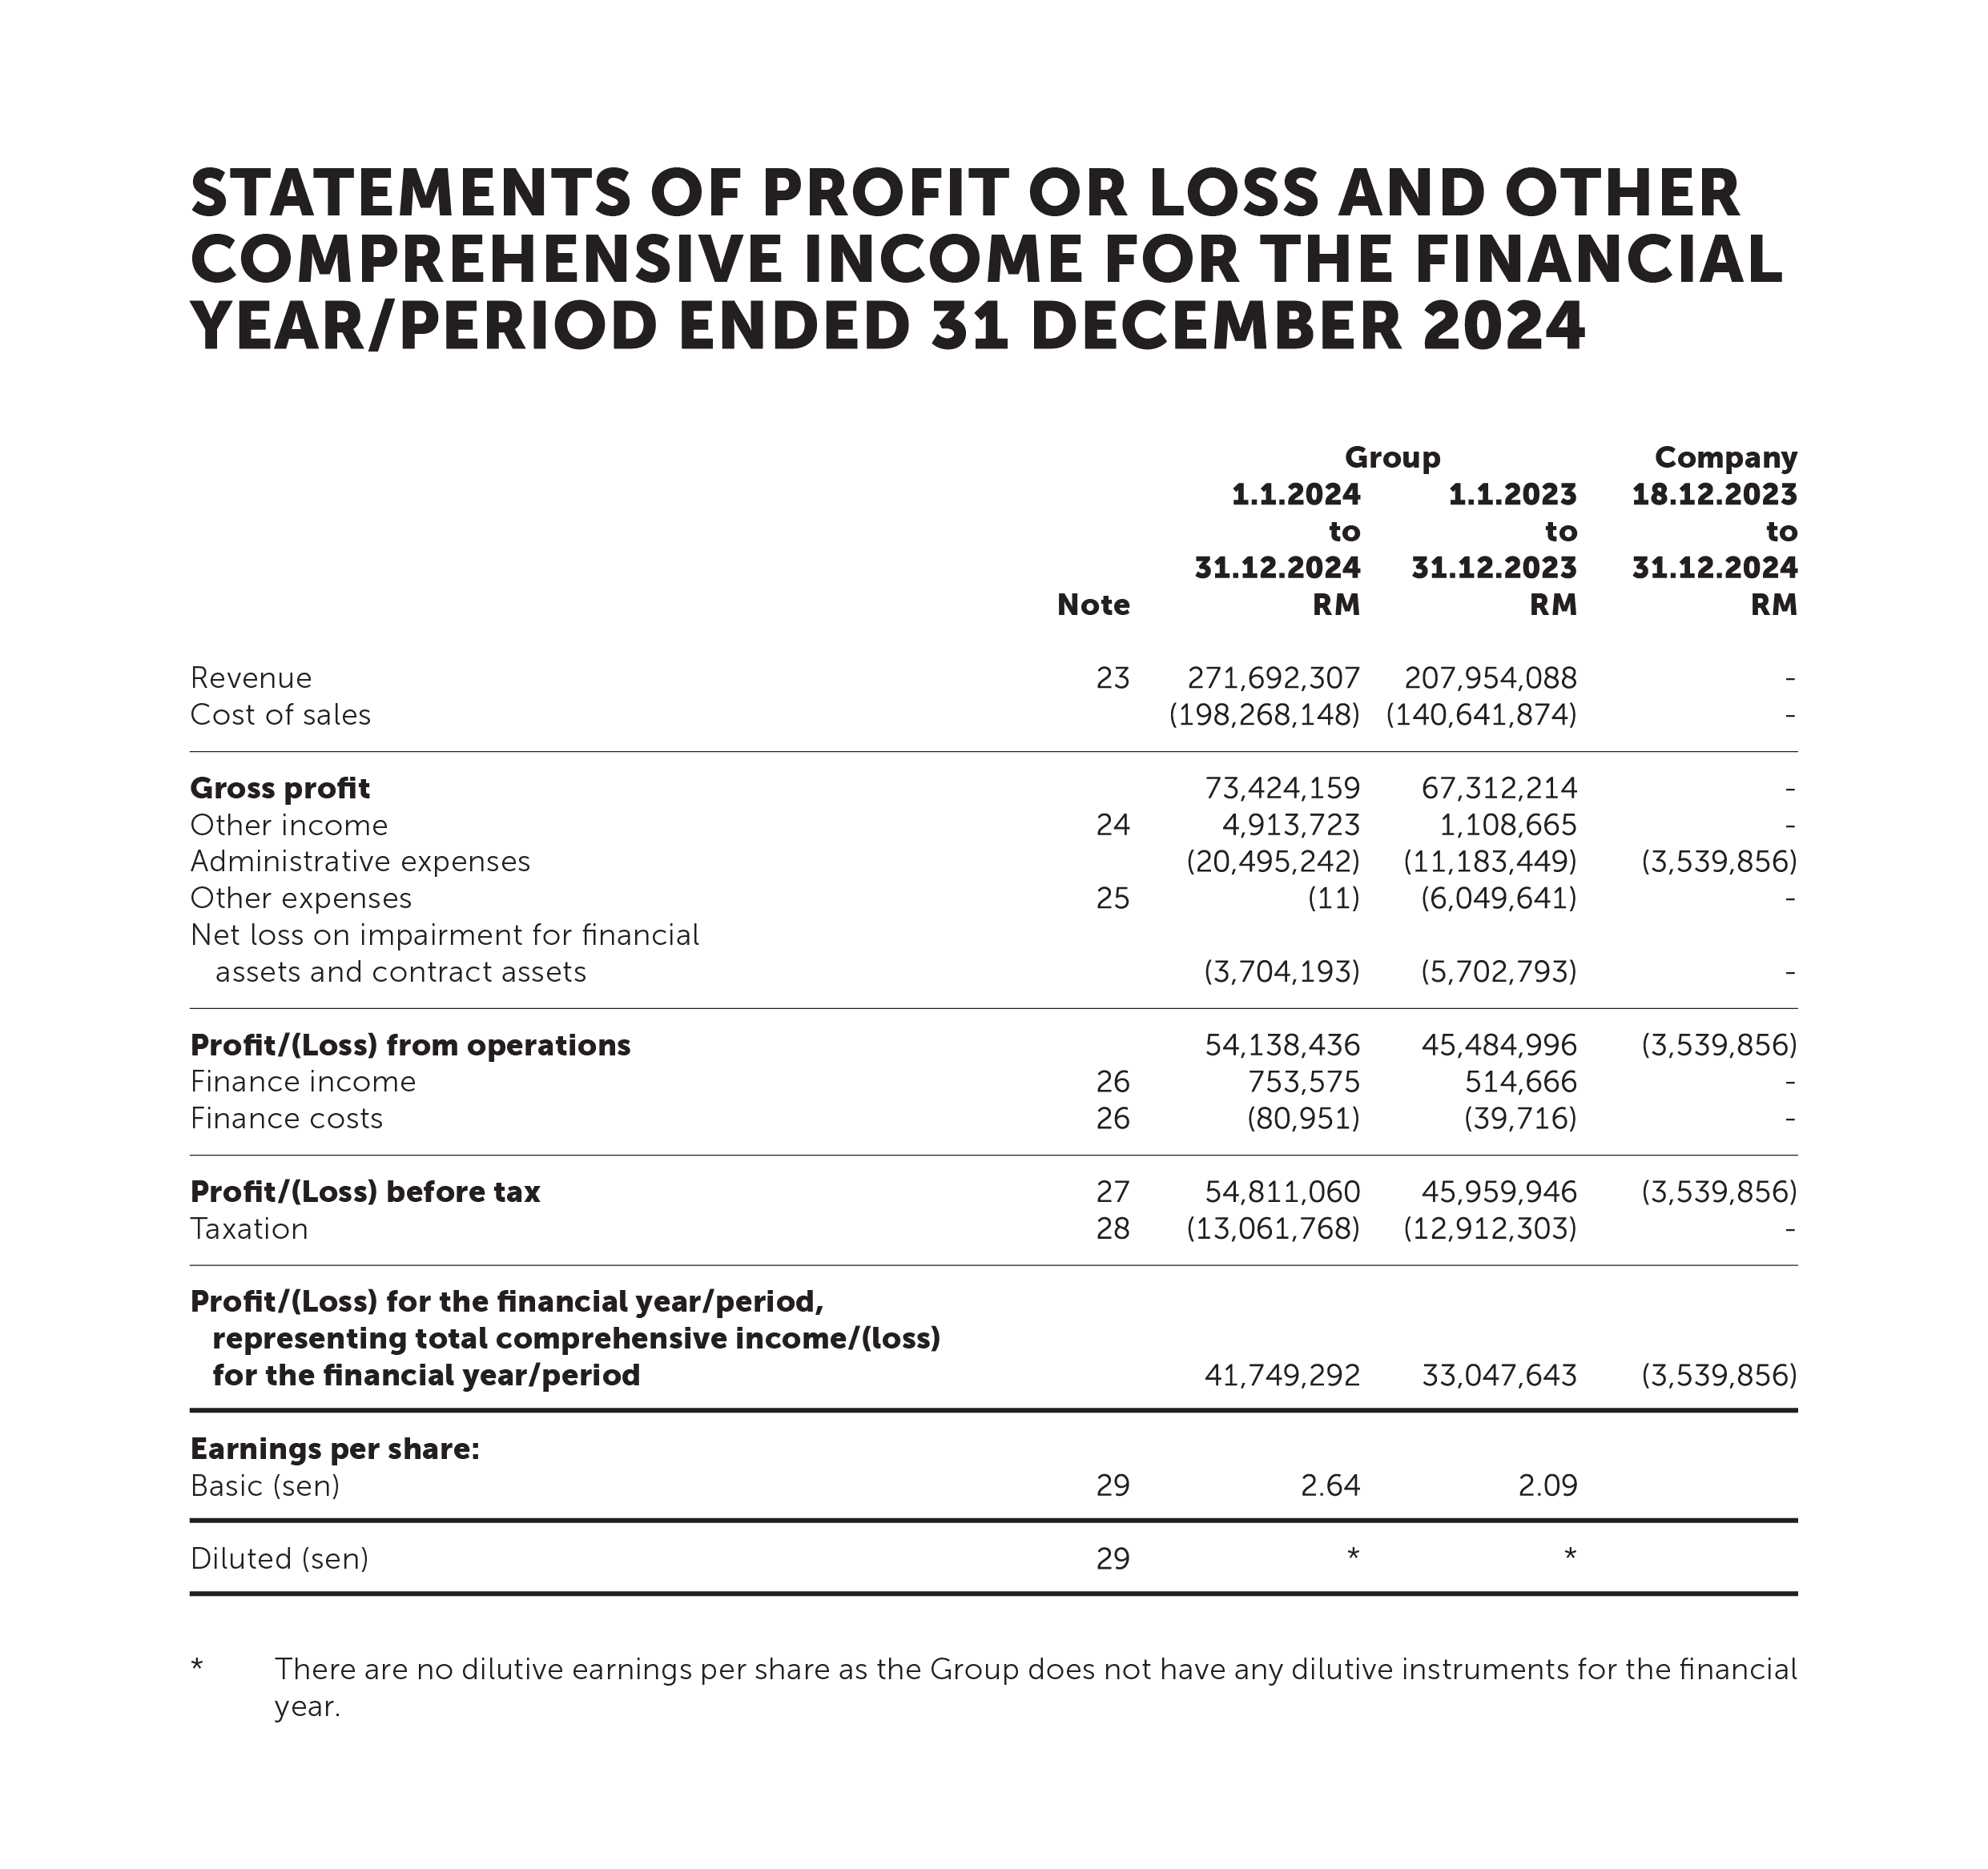
Revenue
(RM '000)
Gross Profit
(RM '000)
Profit Before Tax
(RM '000)
Profit After Tax
(RM '000)


| Based on Closing Price on 13th February 2026 | |
|---|---|
| Closing Price | RM 0.540 |
| 52-Week High2 | RM 0.64 |
| 52-Week Low2 | RM 0.20 |
| P/E Ratio Current Price per Share / Historical Earnings per Share |
0.33 |
| Fundamentals | 2024 | 2023 |
|---|---|---|
| Historical EPS (SEN) | RM 1.63 | RM 0.65 |
| Interest Coverage Ratio Net Profit Before Interest & Income tax / Interest Expense |
-386.12 | 501.63 |
| Growth | 2024 | 2023 |
|---|---|---|
| Revenue Growth (Current Revenue - Last Year Revenue) / Last Year Revenue |
126.31% | 15.45% |
| Profit Growth (Current Profit - Last Year Profit) / Last Year Profit |
150.89% | 64.87% |
| Profitability Ratio | 2024 | 2023 |
|---|---|---|
| Gross Profit Margin on Sales (%) Gross Profit / Revenue |
29.93% | 26.87% |
| Profit Margin (%) Profit / Revenue |
17.20% | 15.52% |
| Liquidity | 2024 | 2023 |
|---|---|---|
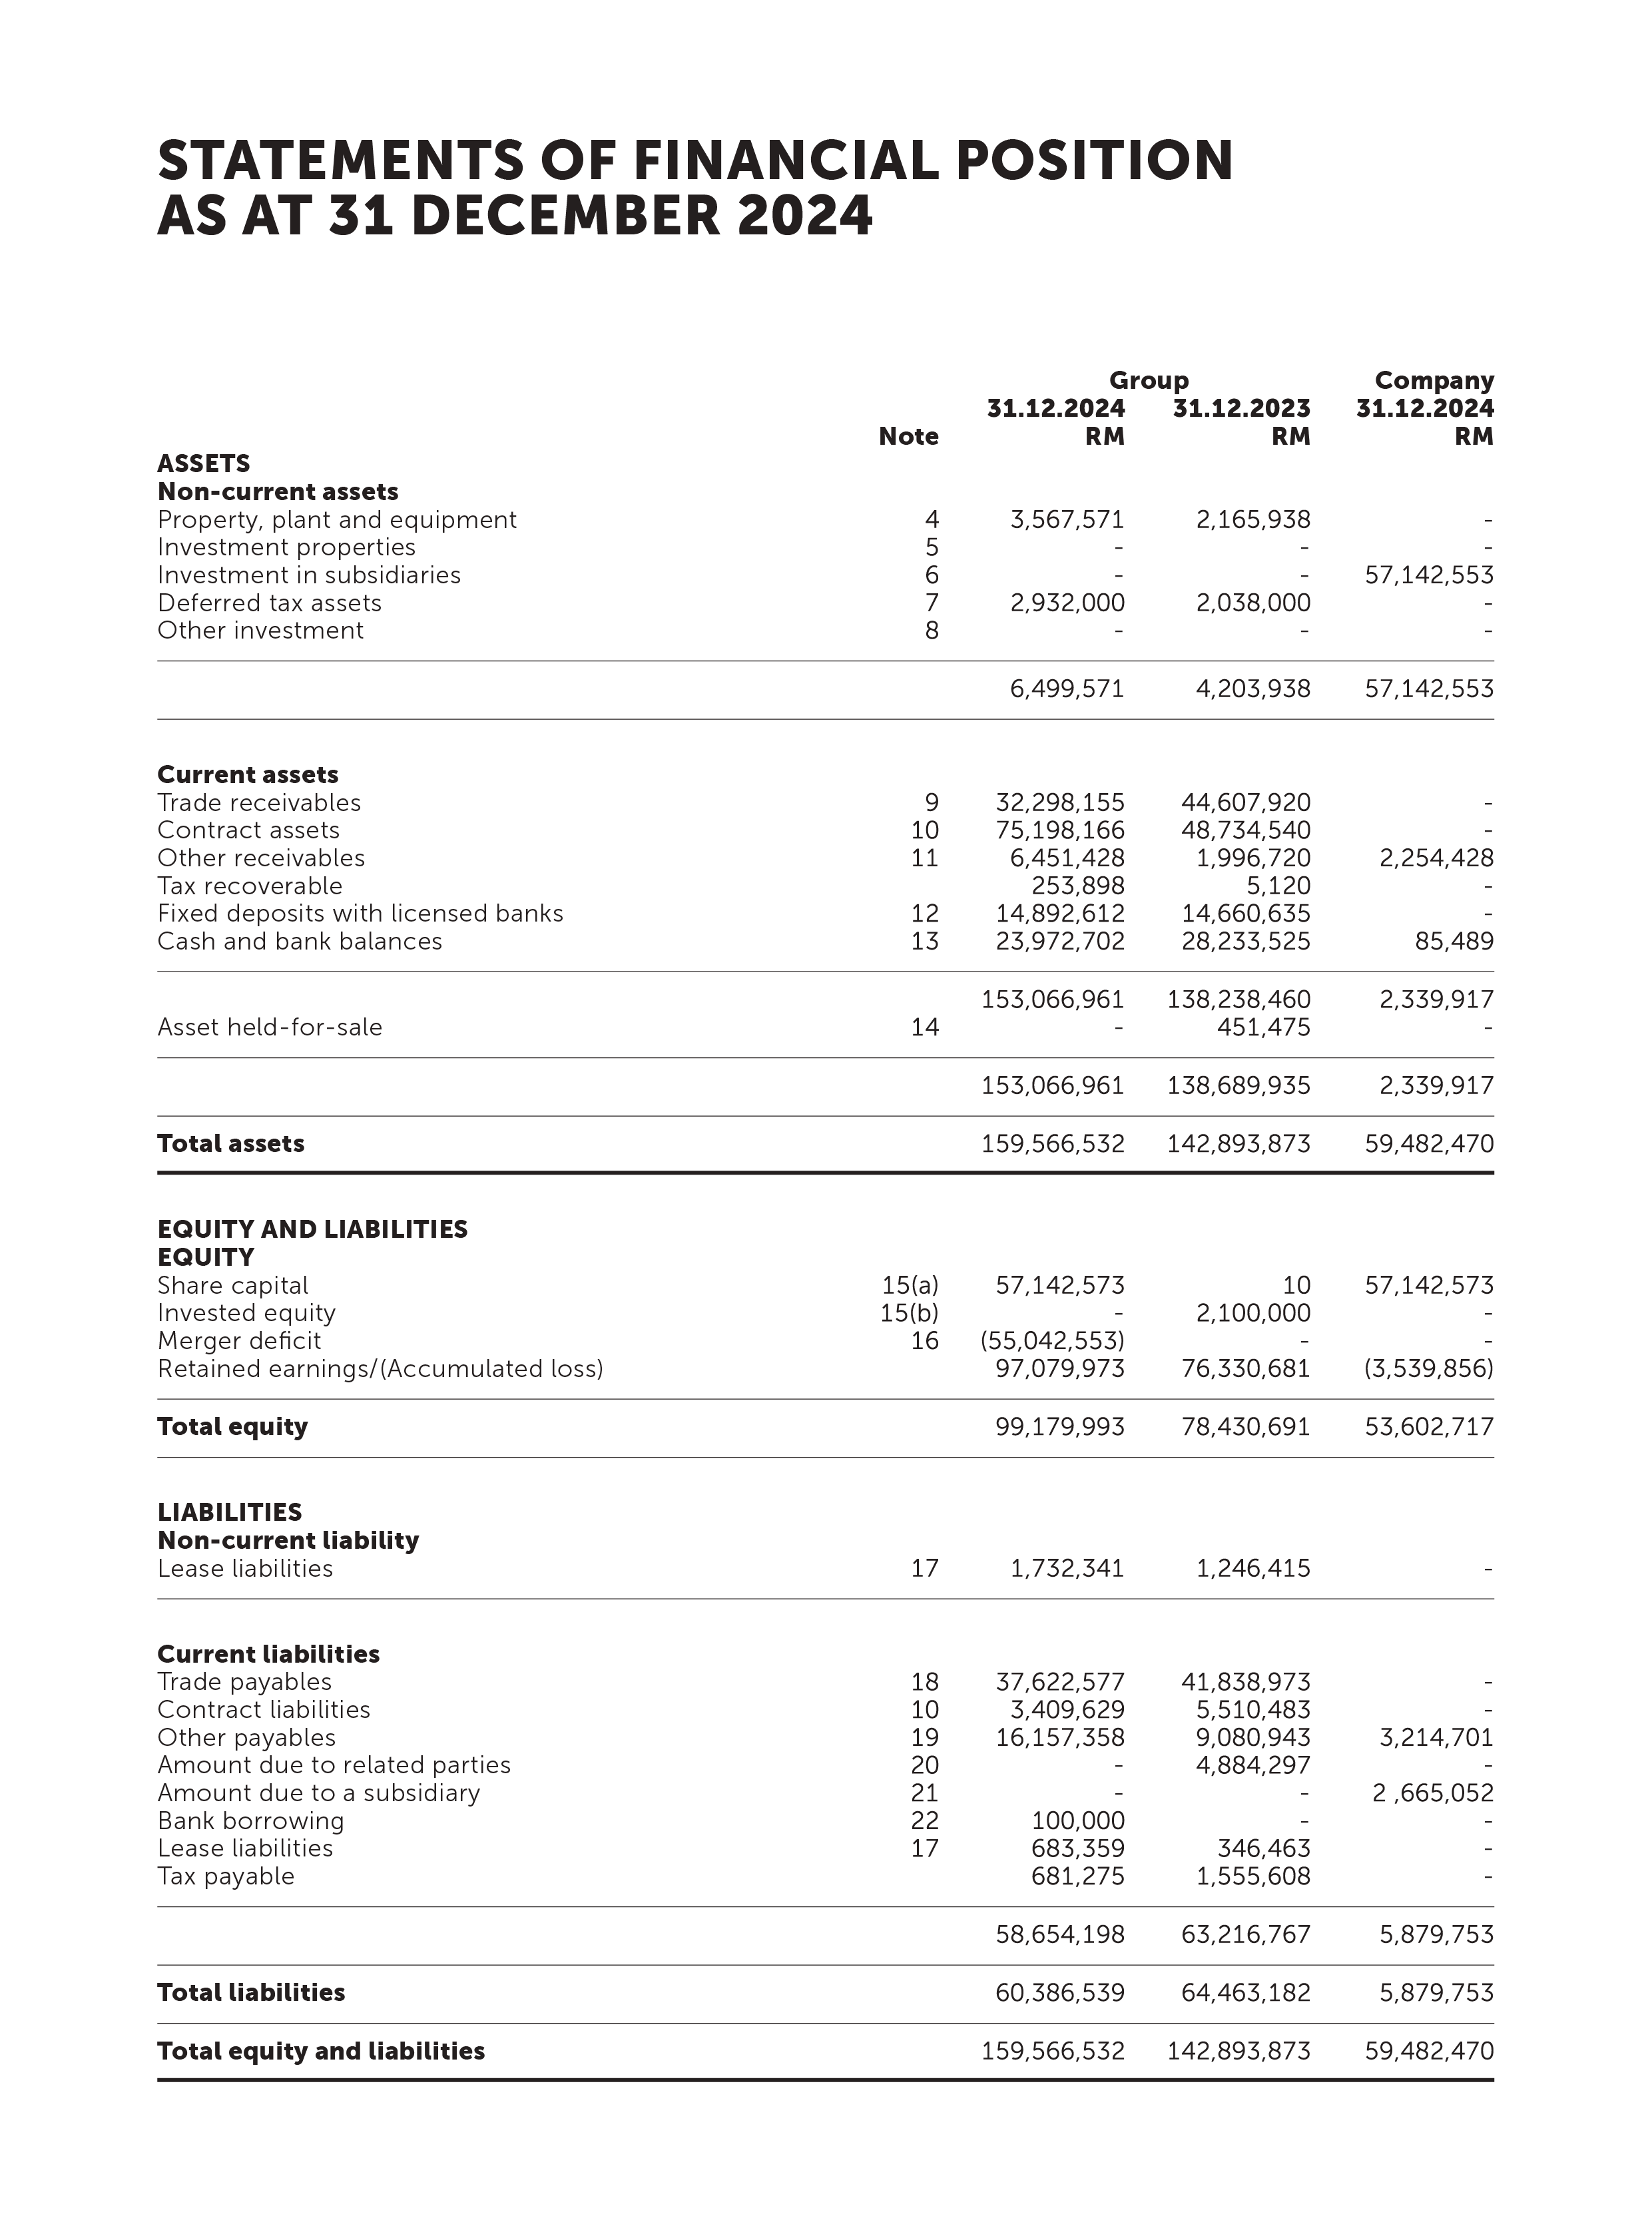
| Current Ratio Total Current Assets / Total Current Liabilities |
2.86 | 2.19 |
| Net Working Capital Ratio (Current Assets - Current Liabilities) / Total Asset |
0.62 | 0.53 |
| Capital Structure Ratio | 2024 | 2023 |
|---|---|---|
| Fixed Assets (Net) / Net Worth Fixed Assets / (Total Assets - Total Liabilities) |
0.03 | 0.03 |
| Debt Ratio Total Liabilities / Total Assets |
0.35 | 0.45 |
| Gearing Ratio Long Term Liability / Total Equity |
0.02 | 0.02 |
- based on latest audited financials statements.
- Based on unadjusted closing price data.
- Based on closing price- 13th February 2026.
