FINANCIAL INFORMATION
If we've captured your interest, find everything you need to know about our key finances right here. All information is released as is for your perusal.
- FINANCIAL STATEMENTS
- FACTSHEET RATIOS
- FINANCIAL HIGHLIGHTS
- DIVIDEND POLICY
The information is retrieved from Annual Report 2024
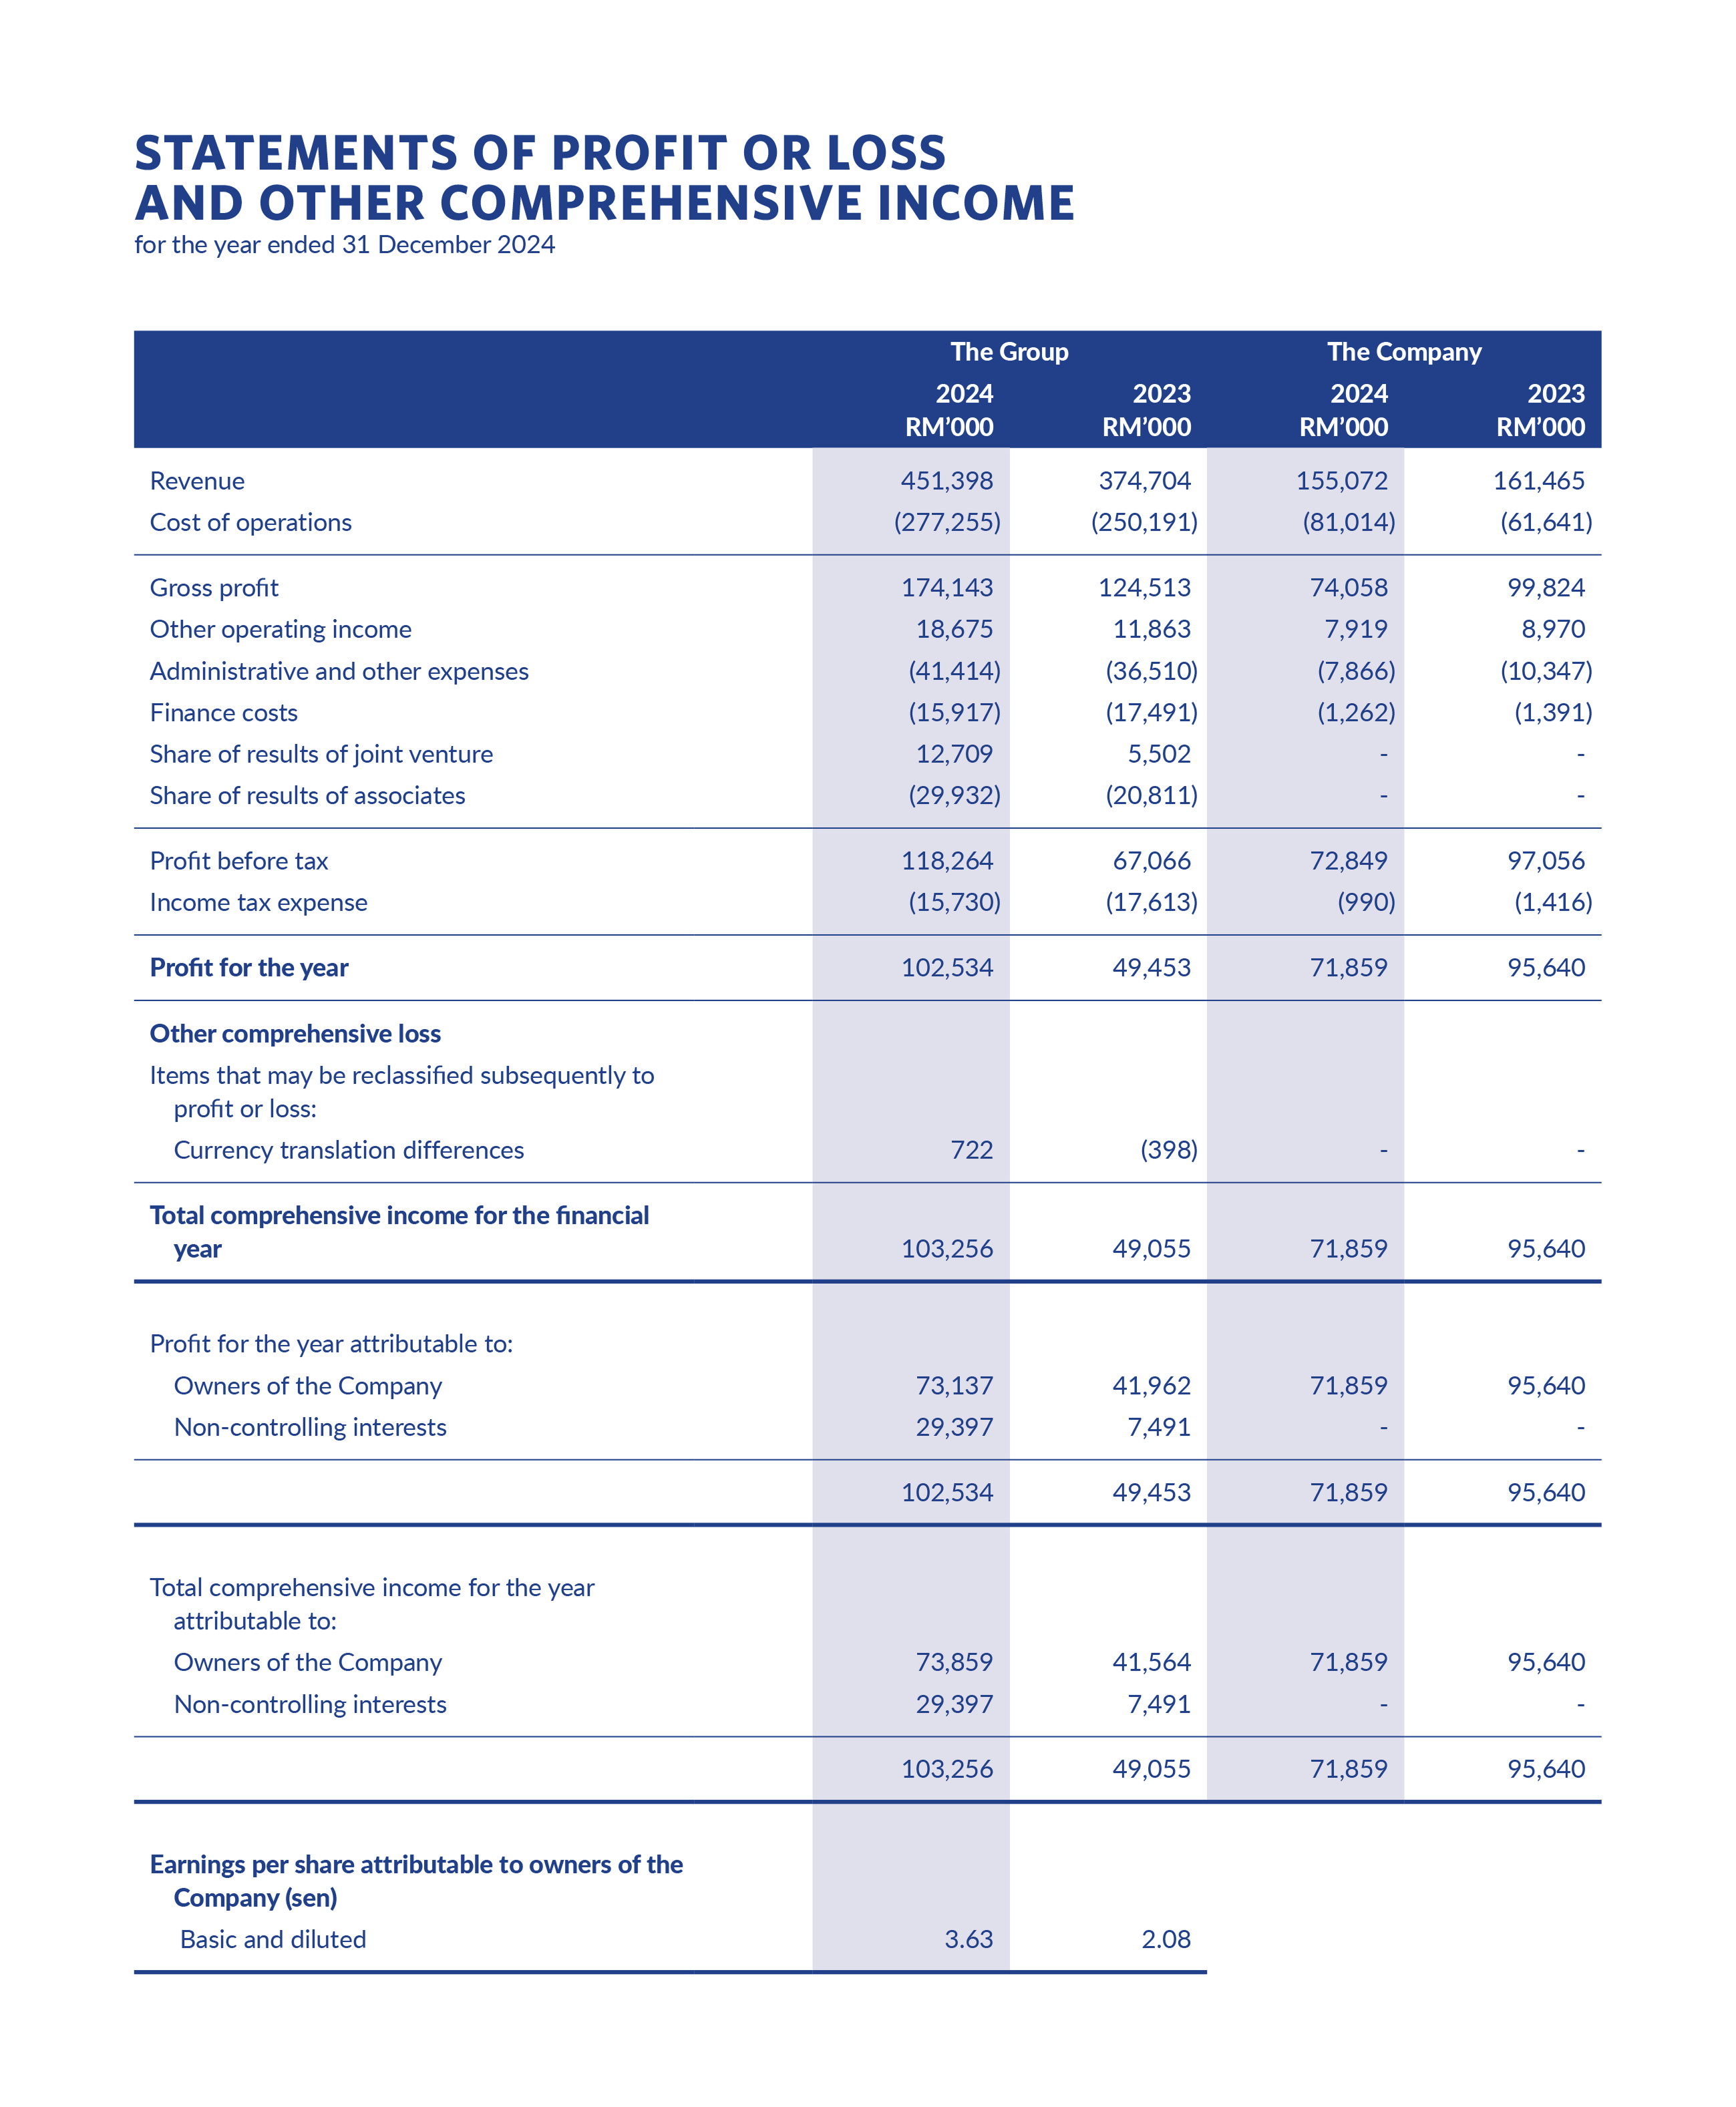
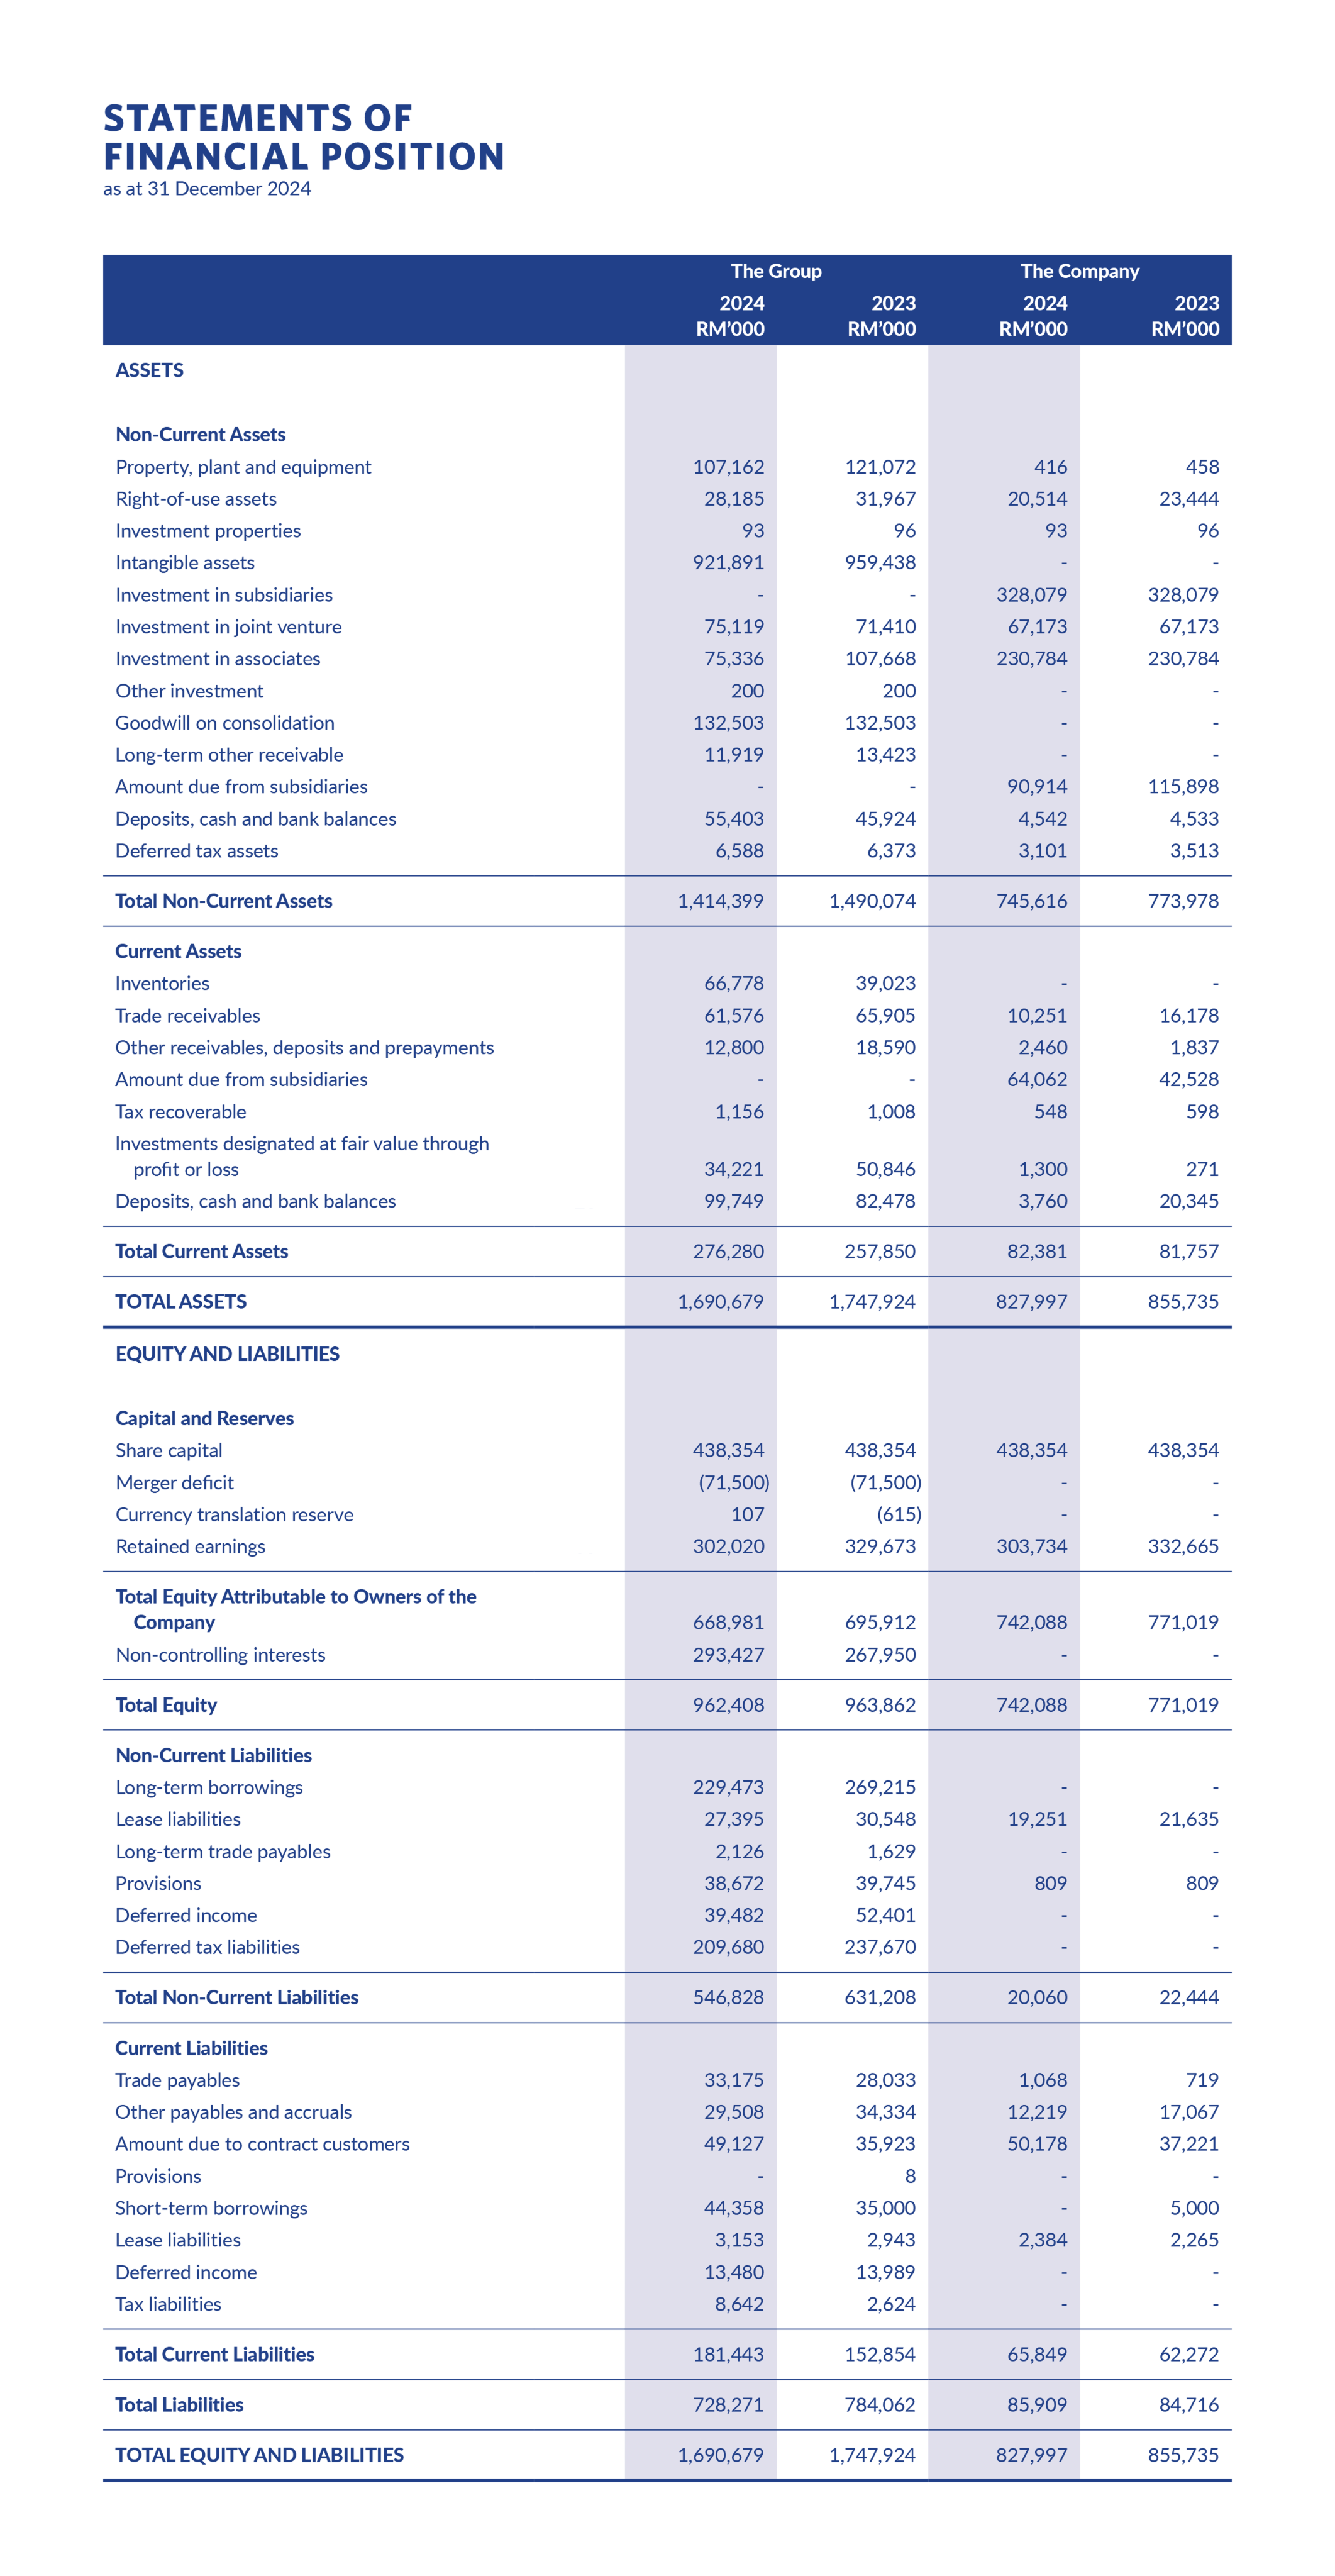
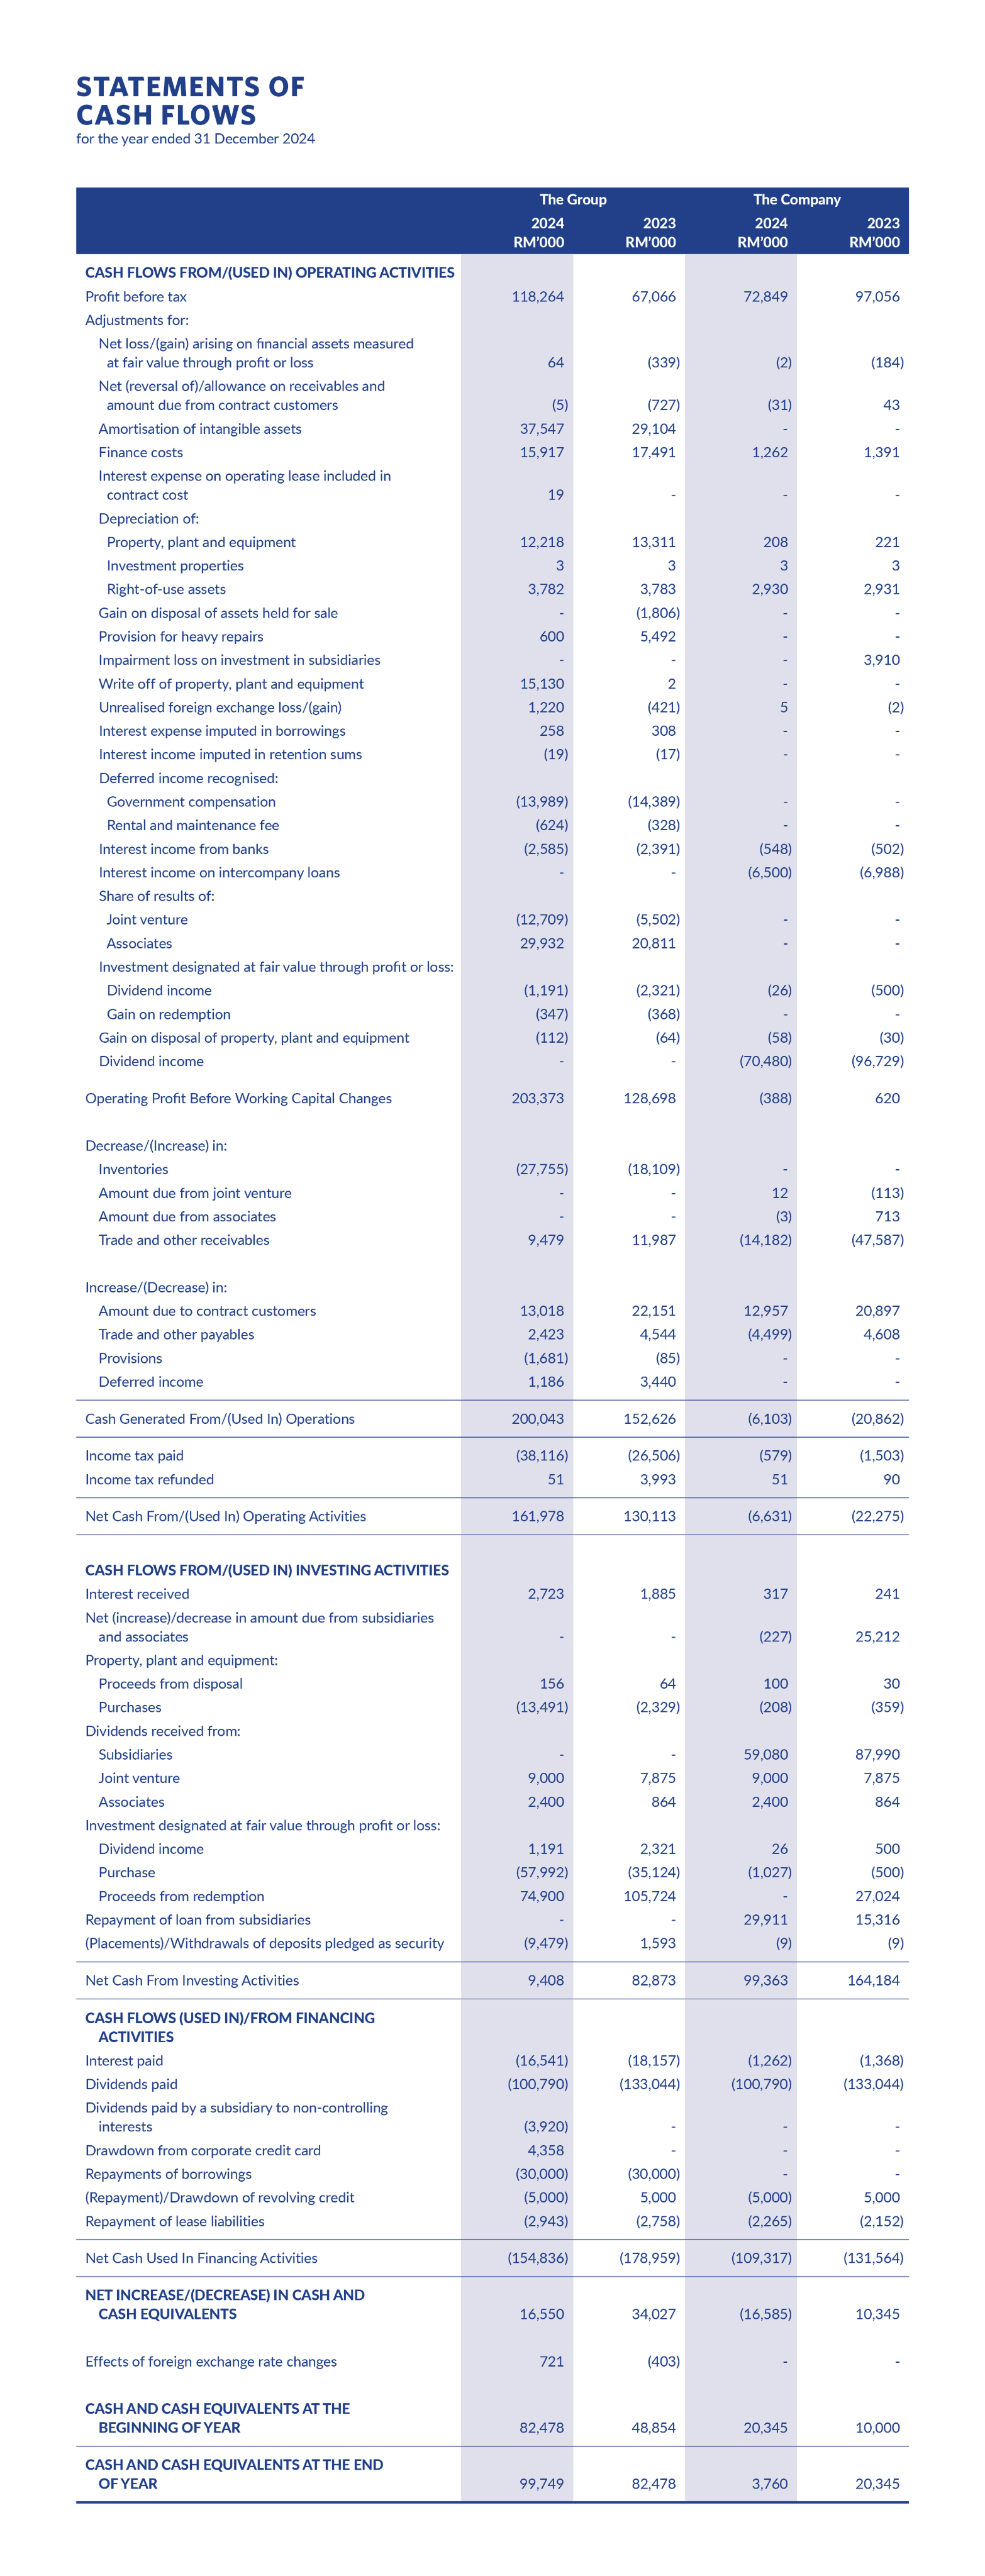
| Income statement | Statement of Financial Position | Cash flow |
|---|---|---|

|
||
DISCLAIMERThe information shown above ("Information") should not be construed as a recommendation by the Company or any other party to subscribe for or purchase the securities of the Company. Further, the information contained herein should not be read as a representation or warranty, expressed or implied, as to the merits of the Company or the purchase thereof. This information is not a substitute for, and should be regarded as, an independent evaluation and analysis. Each user should perform, and is deemed to have made, its own independent investigation and analysis of the Company, its securities and all other relevant matters, including but not limited to the information and data set out in this Information, and each user should consult its own professional advisers.
| Based on Closing Price on 16th of February 2026 | |||
|---|---|---|---|
 |
Closing Price | RM 0.47 | |
 |
52-Week High2 | RM 0.78 | |
 |
52-Week Low 2 | RM 0.45 | |
 |
P/B Ratio 1,3
Current Price per Share / Historical Net Asset Value [NAV] |
1.42 | |
 |
P/E Ratio 1,3 Current Price per Share / Historical Earnings per Share [EPS] |
12.95 | |
| Fundamentals | 2024 | 2023 | |
 |
Historical NAV Total Shareholders’ Equity/ Issued Shares |
RM 0.33 | RM 0.35 |
 |
Historical EPS | RM 0.0363 | RM 0.0208 |
| Profitability Ratio | 2024 | 2023 | |
 |
Return of Assets Employed
[ROA] Profit / Average of the opening and closing Total Assets Employed |
5.96% | 2.75% |
 |
Return on Equity
[ROE] Profit / Average of the opening and closing Total Shareholders' Equity |
10.65% | 4.92% |
| Issued shares based on weighted averaged number of
ordinary shares. |
|||
| 1 | based on latest audited financials statements | ||
| 2 | based on unadjusted close price data. | ||
| 3 | based on close price of the last trading day of the specified year. | ||
| 4 | based on dividend announced in the full year report for financial year 2024. | ||
| 3 | based on closing price - Monday 16th of February 2026. | ||
Disclaimer:
Inaccuracies may sometimes arise in the provision of the financial numbers and calculations of the financial ratio. IRChartNexus Sdn. Bhd., its subsidiaries or partners accept no liability from any loss that may arise from the use of the financial data.
If you see any errors, please report here
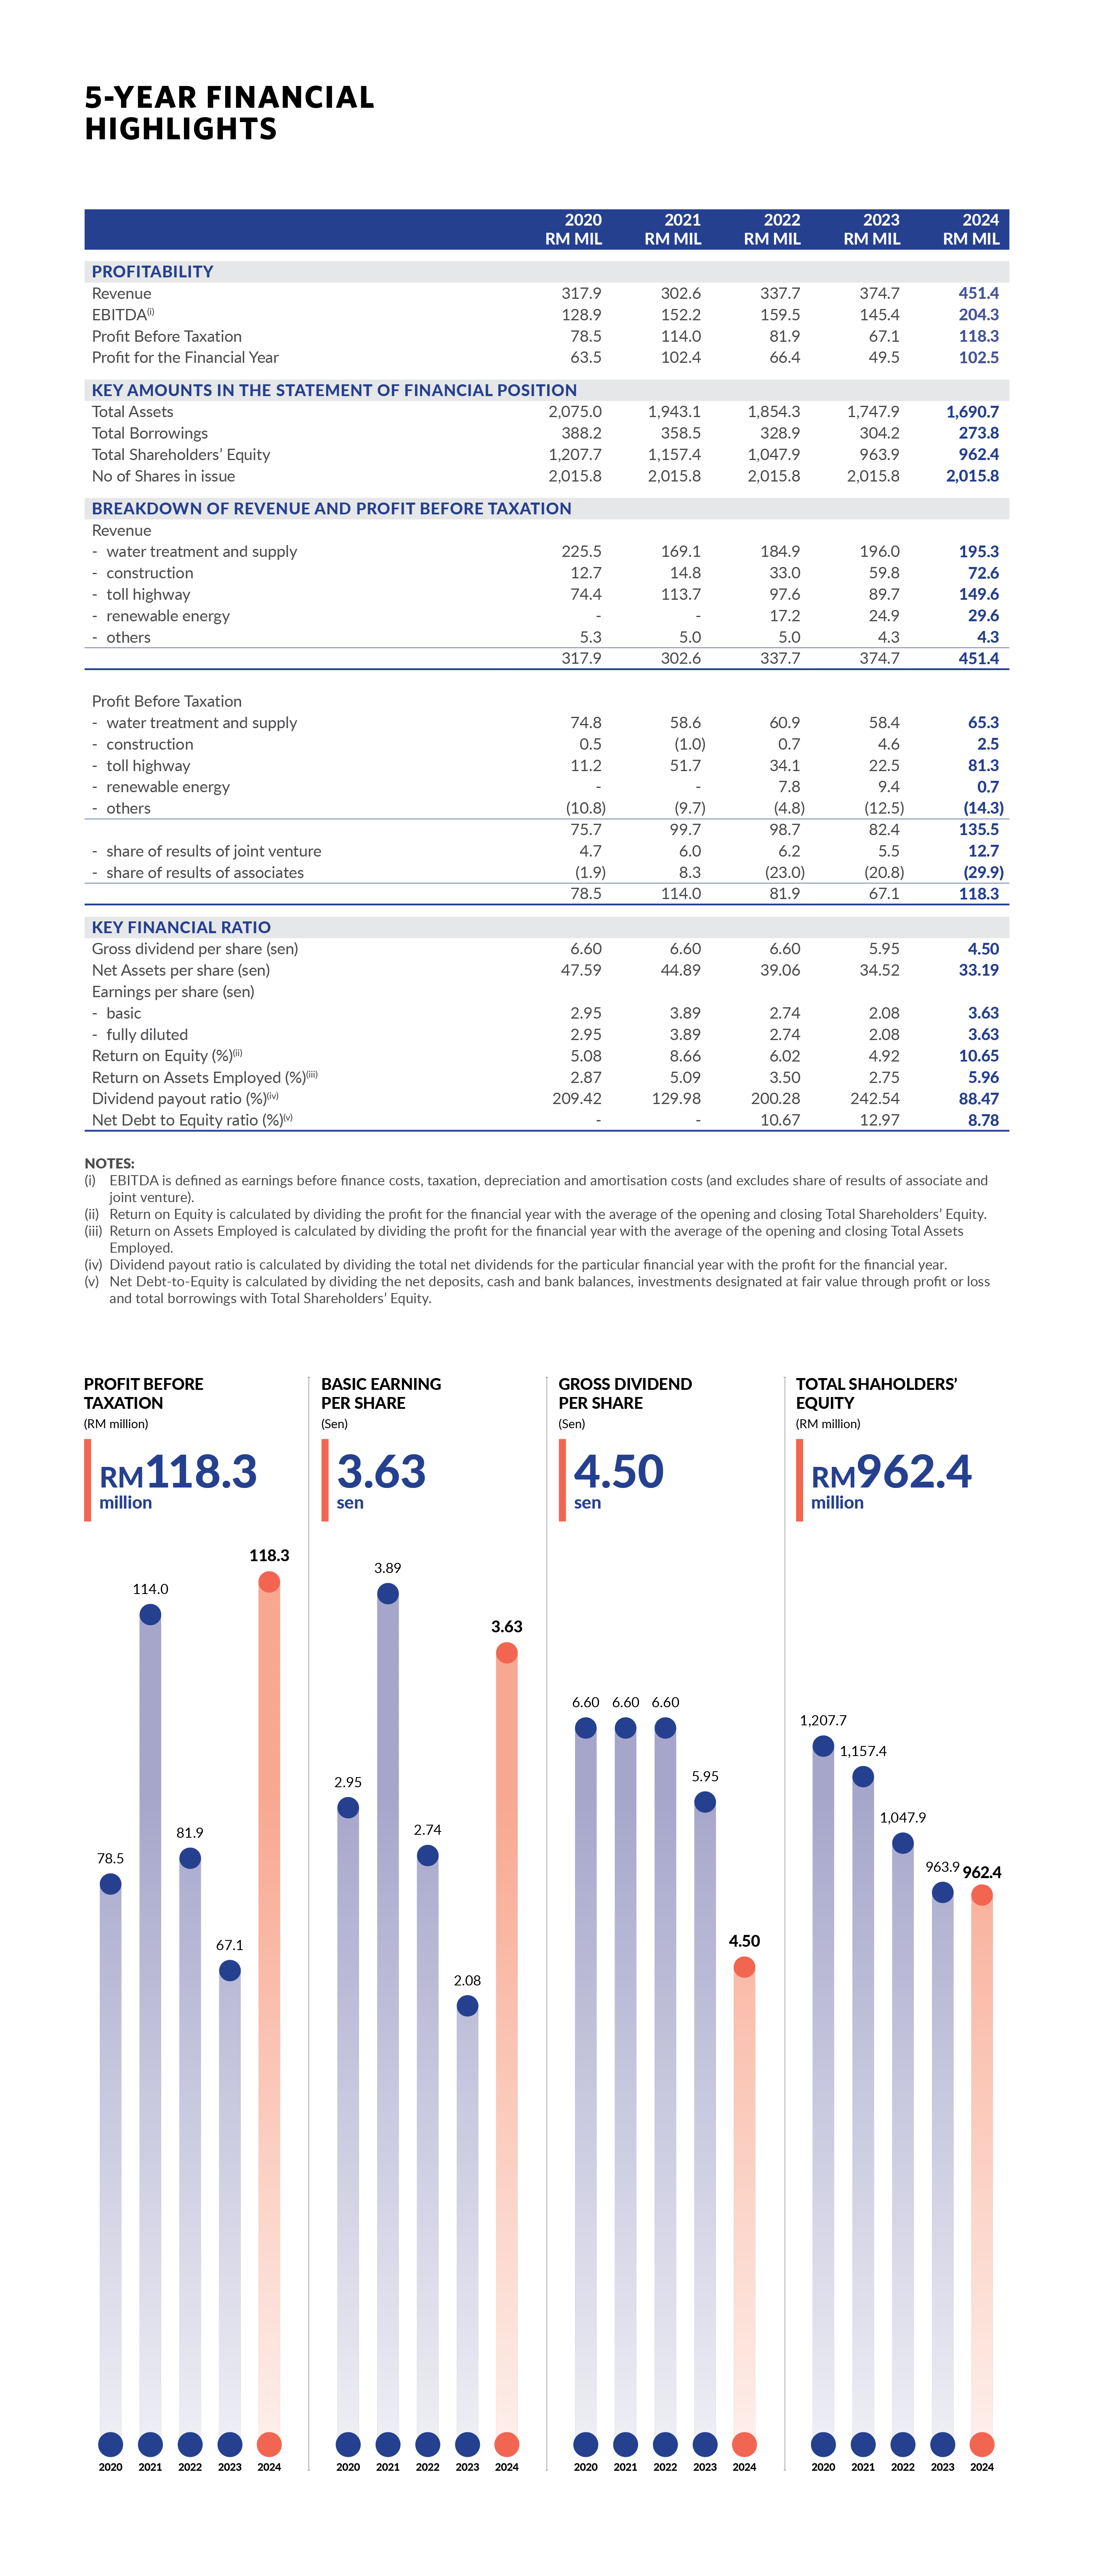
5-YEAR FINANCIAL HIGHLIGHTS


