
Statement of Profit or Loss and Other Comprehensive Income - Key Data & Financal Ratios
Gross Revenue (RM mil)
Net Property Income (RM mil)
Income Available for Distribution
(realised) (RM mil)
Earnings per Unit (realised) (sen)
Distribution per Unit (DPU) (sen)
Distribution Yield (%)
-
Comprehensive Income
-
Financial Position
-
Cash Flow
Comprehensive Income
Financial Position
Cash Flow
-
Comprehensive Income
-
Financial Position
-
Cash Flow
Comprehensive Income
Financial Position
Cash Flow
REVENUE CONTRIBUTION BY SEGMENT (FY2025)
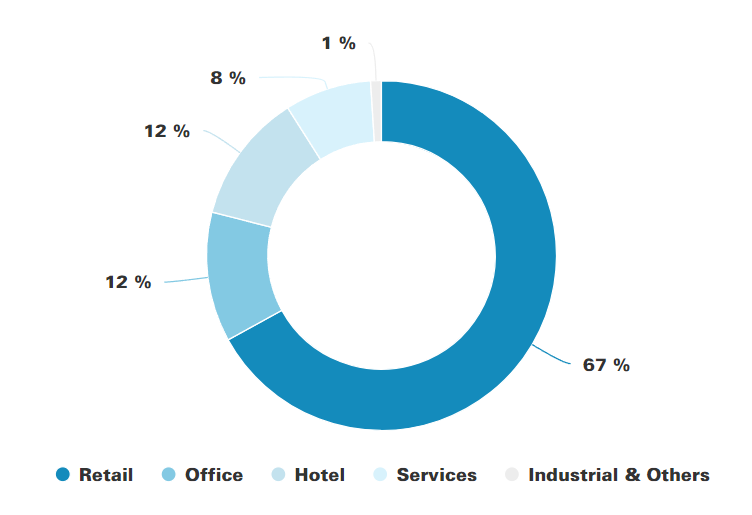
Portfolio by Revenue (FY2025)
RM 849.3 million
NET PROPERTY INCOME CONTRIBUTION BY SEGMENT (FY2025)
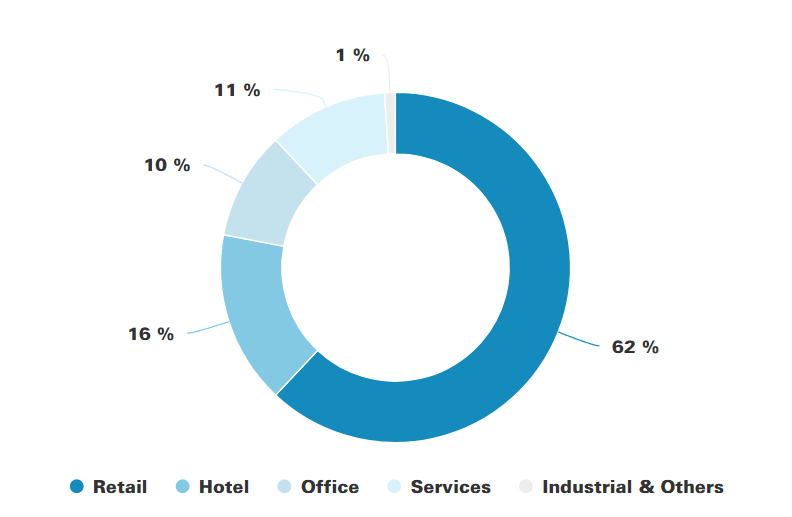
Portfolio by Net Property Income (FY2025)
RM 658 million
Based on Closing Price on 29th July 2026
Closing Price (RM)
2.25
52-Week High (RM)
2.65
52-Week Low (RM)
1.95
NAV Premium1,4 (%)
47.92
Distribution Yield3,4(%)